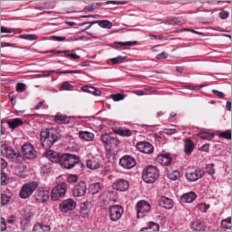
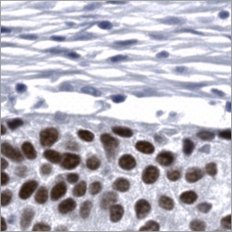
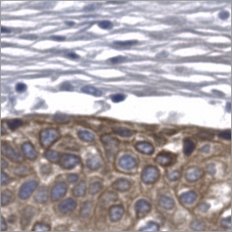
Pictor Labs’ Tissue Intelligence Platform

From the digitized pathology images patients already have, Pictor Labs delivers a tissue intelligence layer: virtual stains fused with clinical, molecular and treatment data, for prognostic and predictive research in any tissue.

How the platform works

  1. 01
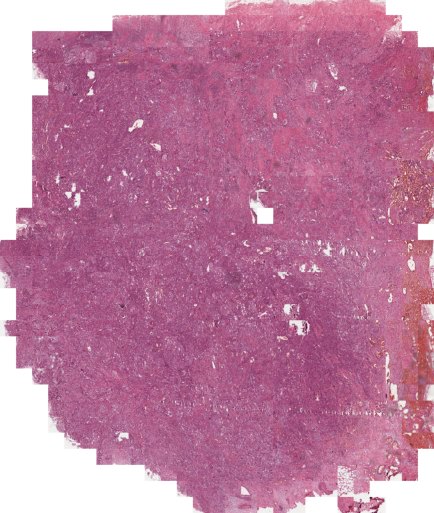
    H&E whole slide image

    Input image

    A single H&E whole slide image.

  2. 02
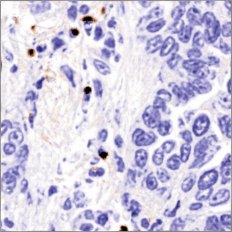
    Virtual CD8 stain
    CD8
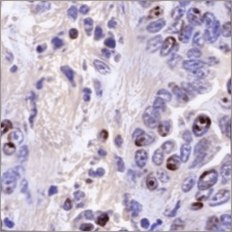
    Virtual Ki67 stain
    Ki67
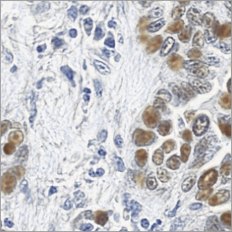
    Virtual p53 stain
    p53
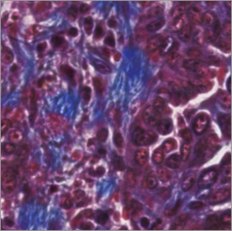
    Virtual Trichrome stain
    Trichrome

    Virtual stain panel

    Intermediate virtual stains reveal additional features from the same section.

  3. 03
    Virtual stainsClinicalMolecularTreatmentFused

    Multimodal fusion

    Information from multiple virtual stains is fused with clinical, molecular and treatment data.

  4. 04
    Low riskHigh riskTIME →
    Illustrative

    Tissue intelligence signal

    An output score linked to research outcomes.

Unique capability

Named tissue features

Measurable readouts of trusted markers with known biology, aligned on the same image and all derived from virtual stains. No new tissue required. A standard panel with indication-specific alignment.

AI powered analysis

Multidimensional signatures

Proprietary prognostic and predictive signals emerge when H&E and virtual stains combine, and are more powerful once fused with clinical, molecular and treatment data.

Indication-specific

Indication-specific assessments

Pre-computed signals may reveal prognosis that clinical or genomic evaluations miss.

Opening the black box

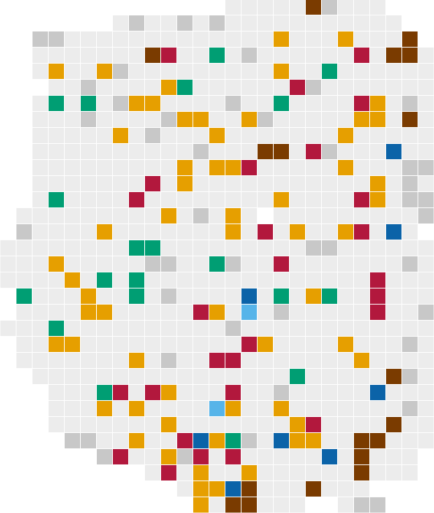
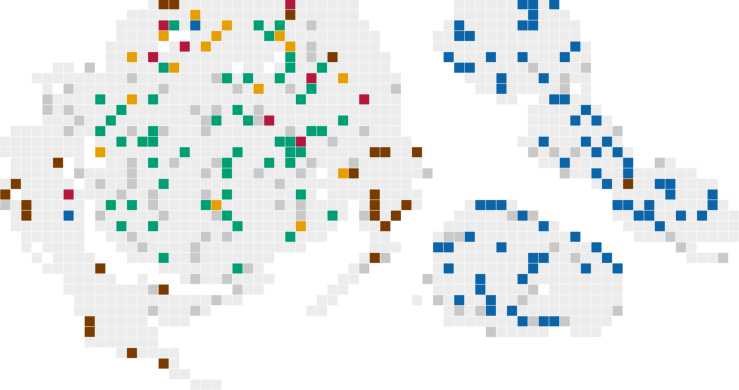
We train the algorithm to correlate the outcome risk with patterns of tissue features. Each case returns the share of tiles in each named tissue state, so a scientist can see what produced the score.

Tissue states and their share of tiles

High-risk patient

Tissue score +1.8

High-risk patient: H&E whole section
H&E, whole section
High-risk patient: tissue tiles coloured by named tissue state
Tissue states

Share of tiles

  • Scar-like stroma, few lymphocytes16%
  • p53-positive nests in scar-like stroma31%
  • Fibrous collagen10%
  • Lymphoid aggregates3%
  • TIL-rich nests1%
  • Solid p40-positive tumor14%

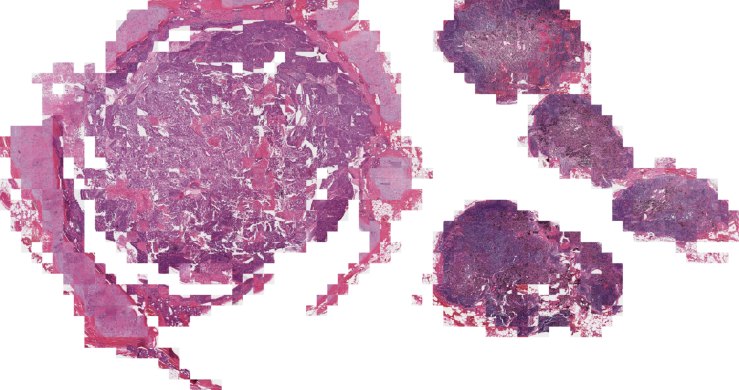
Low-risk patient

Tissue score −1.7

Low-risk patient: H&E whole section
H&E, whole section
Low-risk patient: tissue tiles coloured by named tissue state
Tissue states

Share of tiles

  • Scar-like stroma, few lymphocytes3%
  • p53-positive nests in scar-like stroma7%
  • Fibrous collagen8%
  • Lymphoid aggregates28%
  • TIL-rich nests0%
  • Solid p40-positive tumor19%
Illustrative of the output format.

One routine H&E converts to a multi-marker virtual stain panel

  1. 01H&E
  2. 02Virtual stain panel
  3. 03Outcome data

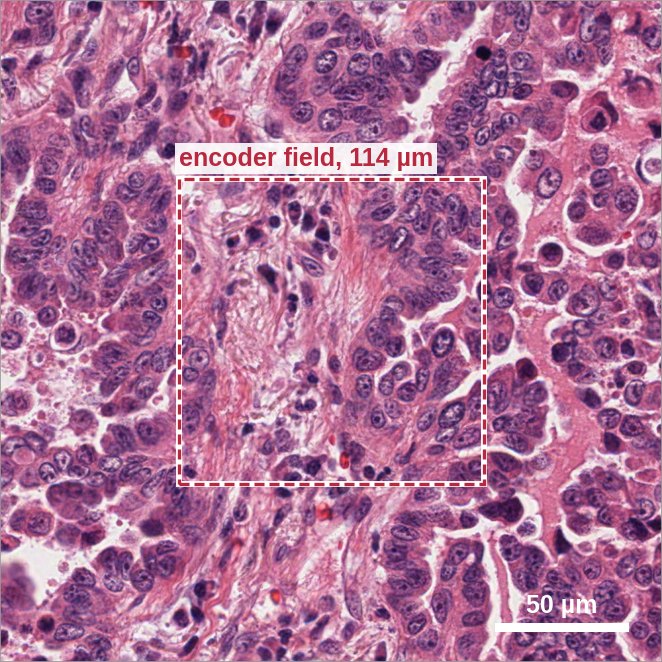
01Input: routine H&E tile (≈246 µm)

Routine H&E tile of lung adenocarcinoma with the central 114 µm field outlinedencoder field, 114 µm50 µm

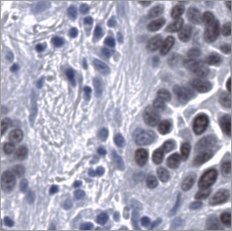
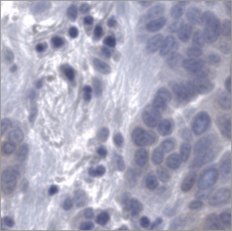
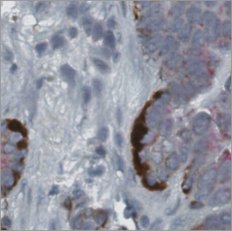
Representative lung adenocarcinoma field. Panels show the outlined central field.

Virtual staining

02Output: virtual stains of the 114 µm field

Adenocarcinoma
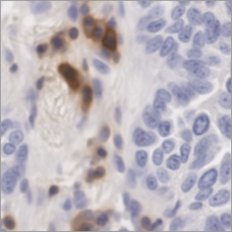
Virtual CD45 stain
CD45
Virtual CD8 stain
CD8
Virtual Ki67 stain
Ki67
Virtual p53 stain
p53
Virtual Trichrome stain
Trichrome
Virtual TTF-1 stain
TTF-1
Virtual Napsin A stain
Napsin A
Virtual AMACR/p63/CK5/14 stain
AMACR/p63/CK5/14

Squamous

Virtual H&E stain
H&E
Virtual p40 stain
p40
Virtual CK5/6 stain
CK5/6

Representative squamous field. p40 and CK5/6 are rendered for squamous cohorts.

03Comparison against outcome data

Overall survival by tissue score groupKaplan–Meier curves over 120 months. Patients with a low tissue score retain higher overall survival than patients with a high tissue score; at 120 months about 38% versus 17%. Hazard ratio 2.24, 95% confidence interval 1.85 to 2.73.0%20%40%60%80%100%024487296120MonthsOverall survival

For Research Use Only. Not for use in diagnostic procedures.

See Pictor Labs on your own H&E slides.

Bring one cohort and one question. We will show you what the tissue already holds.

Talk to Our Team

For Research Use Only. Not for use in diagnostic procedures.